China’s National Bureau of Statistics released July producer-price data on August 9, 2026, with its detailed English-language table posted on August 10. The official July industrial producer-price release shows headline PPI up 3.5% year over year and down 0.7% from June. The purchasing-price index for industrial producers, a closer measure of intermediate inputs bought by industrial enterprises, rose 5.5% year over year but fell 1.0% month over month.
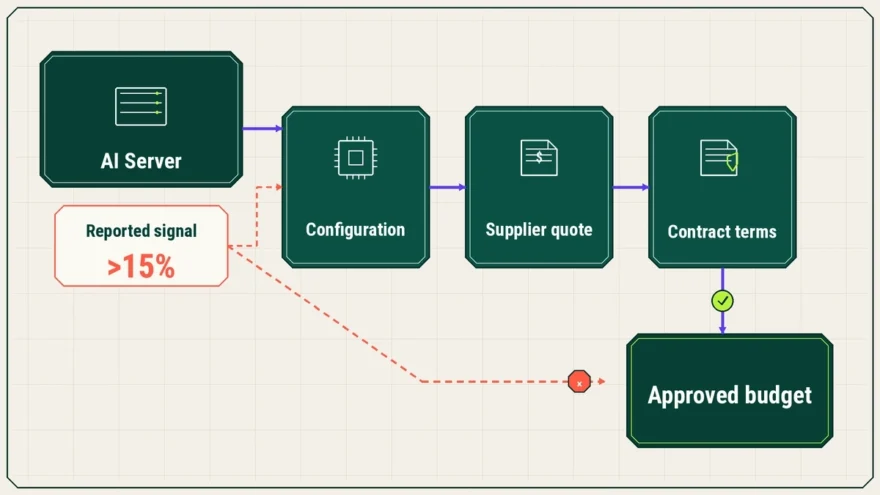
For procurement finance, those readings point to two different horizons. The annual comparison remains elevated, while July’s sequential direction weakened. Neither figure proves what a specific buyer paid under a supplier contract. Standard costs, negotiation bands and margin scenarios should therefore be reset by exposed category, then checked against supplier quotes, product mix, contract terms and landed-cost drivers.
What changed and what it means
Applying the 3.5% headline PPI across the cost base can understate annual nonferrous, energy and chemical exposure while overstating immediate momentum after July’s monthly declines.
- Decision affected
- Reset standard costs, supplier negotiation bands and margin scenarios by exposed category and decision horizon rather than using one China PPI assumption.
- Evidence in brief
- NBS data show July headline PPI at +3.5% year over year and −0.7% month over month, while industrial purchasing prices were +5.5% and −1.0%, with materially different category readings.
- What remains unresolved
- The indexes do not disclose any buyer’s product mix, supplier contract, currency, freight, duty, regional exposure or realised landed-cost pass-through.
- Next verification
- Map NBS categories to exposed spend and supplier quotes, then reassess after the August PPI release scheduled for September 9, 2026.
Key takeaways
- China’s July headline PPI slowed to 3.5% year over year from 4.1% in June, while the monthly decline widened to 0.7%.
- The industrial purchasing-price index was higher at 5.5% year over year, but it also fell 1.0% from June.
- Nonferrous metals and cables were still up 19.0% annually; fuel and power and raw chemicals were each up 9.3%, even as all three fell during July.
- Procurement teams should separate annual baseline pressure from recent price direction and require buyer-specific evidence before changing costs or supplier ranges.
The 3.5% headline is not the buyer index
The NBS defines the headline PPI as the change in prices when industrial products are sold for the first time by industrial enterprises. Its purchasing-price index instead measures price changes for intermediate inputs purchased by industrial enterprises. That makes the purchasing index more relevant to procurement, but it is still a broad national index rather than a company’s realised input-cost rate.
| Measure | June 2026 | July 2026 | Procurement interpretation |
|---|---|---|---|
| Producer price index for industrial products | +4.1% year over year; −0.3% month over month | +3.5% year over year; −0.7% month over month | Factory-gate selling-price signal, not a blanket purchasing assumption |
| Purchasing-price index for industrial producers | +6.4% year over year; −0.2% month over month | +5.5% year over year; −1.0% month over month | Closer to industrial inputs, but still requires category and buyer mapping |
Compared with June, annual headline growth eased by 0.6 percentage points and annual purchasing-price growth eased by 0.9 points. At the same time, both indexes recorded larger monthly declines. Applying 3.5% or 5.5% across the cost base would collapse different measures, periods and categories into one unsupported rate.
Before using the index in a cost model, reconcile the exposed population and category mapping through a decision-specific spend-data readiness framework. A buyer whose China exposure is concentrated in nonferrous components faces a different external signal from one buying building materials, food inputs or finished consumer goods.
Annual pressure and July easing point in different directions
Year-over-year and month-over-month comparisons answer different questions. The annual reading compares July 2026 with July 2025, while the monthly reading compares July with June 2026. A category can therefore remain far above its year-earlier level while declining during the latest month.
| Category | June year over year | July year over year | July month over month | Decision signal |
|---|---|---|---|---|
| Nonferrous metals and cables | +21.6% | +19.0% | −1.4% | Annual exposure remains high, but June’s level should not be extrapolated as current momentum. |
| Fuel and power | +11.8% | +9.3% | −2.6% | Retain an annual stress case while testing whether recent easing appears in supplier and logistics evidence. |
| Raw chemical materials | +11.5% | +9.3% | −2.6% | Separate the annual baseline from the next negotiation trigger and actual quote movement. |
The June NBS release confirms the prior category readings. Reuters reported that lower oil prices and weak demand contributed to July’s moderation, while also noting that rising input costs could squeeze manufacturers’ margins. That context supports sensitivity testing, not a forecast that every category will continue falling.
Separate the three procurement decisions
| Decision | How the NBS data can help | Control before action |
|---|---|---|
| Standard-cost reset | Use the annual purchasing-price category as an external stress indicator for the relevant input family. | Map the bill of materials and spend share, then reconcile to supplier quotes, contracts and actual purchase prices. |
| Supplier negotiation band | Use the monthly category movement to test whether the opening range or escalation trigger still reflects recent direction. | Check the supplier’s index clause, reset date, quote history and any lag between commodity movement and invoiced price. |
| Margin scenario | Build separate category sensitivities instead of applying one China inflation rate to all materials. | Keep price, volume, mix, currency, freight, duty and pass-through assumptions distinct. |
Each material assumption should retain its source, comparison period, unit, category mapping, owner and change history. The input-contract and scenario-governance model provides the wider control structure for keeping the approved baseline, current forecast and alternative cases separate.
What the NBS indexes do not establish
The release does not disclose a buyer’s supplier mix, contract formula, currency exposure, freight, duties, rebates, inventory timing or regional sourcing pattern. It also does not show how quickly an upstream price move passes through to a particular component or finished good. Those are company-level evidence questions. For ocean freight, Maersk’s 2026 freight-budget signal shows why a carrier-wide loaded rate still needs buyer-specific contract and lane evidence. Cisco’s AI orders and inventory-commitment test shows why component commitments, purchase costs, product mix and customer price recovery must be reconciled before finance changes a gross-margin assumption. The Antofagasta copper-guidance procurement test applies the same rule to a producer-specific signal: revised output guidance does not establish a buyer allocation, contract pass-through or stock requirement. The U.S. drone-tariff procurement map shows why duty exposure also depends on classification, capability, certified origin and customs-entry timing.
The purchasing-price survey covers nine major categories and more than 800 basic categories, while the wider PPI survey covers more than 40,000 industrial enterprises across China. Broad coverage improves the value of the macro signal, but it does not make the index a substitute for purchase-order, invoice or supplier-quote evidence.
A methodology change also belongs in the assumption record. From January 2026, the NBS has used 2025 as the PPI base period and adjusted survey categories, sampled enterprises, representative items and weights. The agency estimates that this rotation affects the monthly year-over-year PPI by about 0.08 percentage points on average.
Checks before changing supplier and margin assumptions
- Map exposure: identify China-linked spend by input family, supplier, legal entity and product line rather than by supplier address alone.
- Reconcile evidence: compare the NBS category with current quotations, purchase orders, invoices and any contract index clause.
- Separate horizons: use annual readings for baseline and stress-case review, and monthly readings for recent direction and negotiation triggers.
- Isolate landed-cost drivers: keep currency, freight, duties, taxes, rebates and inventory timing outside the producer-price assumption unless separately evidenced.
- Set the next review: document the condition that changes the assumption and revisit it after the next official release or a material supplier quote.
The NBS 2026 release calendar schedules the August industrial producer-price report for September 9 at 09:30, subject to adjustment. Until then, July justifies a category-level review. It does not justify an automatic cost reset based on the headline rate.