A.P. Moller – Maersk raised its full-year 2026 guidance for the second time on August 13. Underlying EBITDA moved to USD 10.5-12.5 billion, underlying EBIT to USD 4.5-6.5 billion and free cash flow to greater than zero. The update is current company guidance, not a completed full-year result. It followed a quarter in which Maersk’s average loaded Ocean freight rate reached USD 2,746 per forty-foot equivalent unit (FFE), up 22% year over year and 32% from Q1.
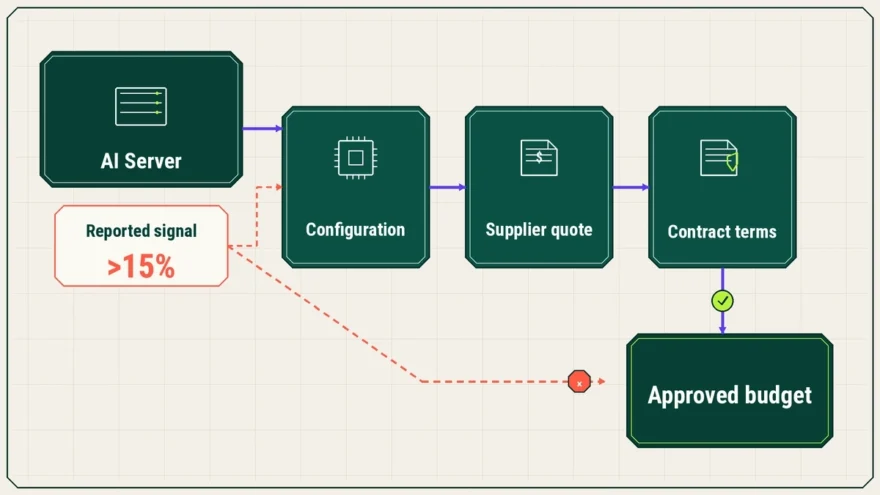
For ocean-freight procurement, that average is a warning signal rather than a rate card. It combines Maersk’s global lane and rate-product mix, while a buyer pays under specific contracts, surcharge formulas and shipment conditions. The budget decision is to separate signed base rates, formula-based pass-throughs and uncontracted disruption exposure. Maersk argues that demand, trade imbalances and infrastructure constraints are putting structural pressure on rates, but current benchmarks still move differently by lane. Procurement should not label every congestion cost temporary or permanent before reconciling the contract and lane evidence.
What changed and what it means
Using Maersk’s carrier-wide rate as a buyer baseline can overstate or understate lane spend and obscure which costs are committed, variable or scenario-dependent.
- Decision affected
- Reforecast remaining-2026 ocean-freight spend and set tender or renewal assumptions by separating contracted base rates, formula-based pass-throughs and uncontracted disruption exposure.
- Evidence in brief
- Maersk raised EBITDA, EBIT and free-cash-flow guidance on August 13; its Q2 materials show higher loaded rates, contract mix, bunker costs, congestion costs and explicit EBIT sensitivities.
- What remains unresolved
- Maersk does not disclose any buyer’s lane rates, contract expiry, committed volume, surcharge formula, free time or how long each congestion premium will persist.
- Next verification
- Reconcile each lane to signed terms, invoice lines and comparable spot and contract benchmarks, then retain uncontracted premiums in dated scenarios with expiry triggers.
Key takeaways
- Maersk raised its 2026 EBITDA and EBIT ranges by USD 2.5 billion at the midpoint and improved its free-cash-flow floor to greater than zero.
- Its Q2 average loaded rate rose 22% year over year, but the carrier-wide figure does not establish a buyer’s lane-level contract cost.
- Procurement should keep contracted base rates, formula-based pass-throughs and uncontracted disruption exposure in separate budget lines.
- Maersk’s USD 700 million EBIT sensitivity is an all-else-equal carrier measure, not a multiplier for a shipper’s freight budget.
What changed in Maersk’s 2026 outlook
The exact prior state was Maersk’s June 29 guidance upgrade. The August ranges lift both EBITDA and EBIT by USD 2.5 billion at the midpoint. The free-cash-flow floor improves by more than USD 1.5 billion, while the full-year global container-market volume assumption remains about 4%.
| Measure | June 29 guidance | August 13 guidance |
|---|---|---|
| Underlying EBITDA | USD 8-10 billion | USD 10.5-12.5 billion |
| Underlying EBIT | USD 2-4 billion | USD 4.5-6.5 billion |
| Free cash flow | At least negative USD 1.5 billion | Greater than USD 0 |
| Global container-market volume growth | About 4% | About 4% |
The unchanged volume assumption matters. Maersk says the new range reflects Q2 performance and improved visibility for the rest of 2026, but it does not publish a complete June-to-August group bridge. Procurement should not allocate the entire earnings increase to its own freight-rate assumption.
Why Maersk’s average loaded rate is not a buyer rate card
Maersk’s Q2 investor presentation reports an average loaded rate of USD 2,746 per FFE, up 22% year over year and 32% sequentially. Long-term products of more than three months represented 44% of Q2 rate-product share, with 46% estimated for 2026. The average does not disclose a buyer’s lane, equipment, service, committed volume, renewal date or surcharge structure.
Independent spot evidence shows why lane mapping matters. On August 13, Drewry’s World Container Index rose 1% overall. Shanghai-New York and Shanghai-Los Angeles rates increased 10% and 6%, while Shanghai-Genoa and Shanghai-Rotterdam rates fell 8% and 5%. A global average can rise while a buyer’s lane moves in the other direction.
Contract horizon also changes the signal. Xeneta’s August 13 update showed much larger increases in spot than long-term rates across major Far East trades since the end of February. That supports separate contract and spot assumptions. The same evidence rule applies to category-level procurement assumptions: a valid aggregate measure is not necessarily the buyer’s realised cost.
Separate contracted rates, pass-throughs and disruption scenarios
Maersk’s Q2 Ocean bridge separates the economics. Compared with Q2 2025, freight rates added USD 1.568 billion to Ocean EBITDA and volume added USD 185 million. Bunker prices reduced EBITDA by USD 612 million, container-handling costs by USD 169 million, and timing and other items by USD 387 million. This is a carrier-side quarterly bridge, not a buyer cost allocation or a full-year guidance reconciliation. It still shows why procurement should not compress every movement into one rate assumption.
| Budget line | What belongs there | Control before rebasing |
|---|---|---|
| Contracted baseline | Signed lane rate for covered volume, service and contract period | Reconcile allocation, commitment, equipment, port pair and renewal date to the agreement. |
| Formula-based pass-through | Fuel, security, canal, emissions or other contractually variable charges | Use the stated index, base, lag, reset frequency, cap, floor and effective date. |
| Disruption scenario | Uncontracted spot premium, congestion storage, emergency routing or uncovered volume | Record the lane, shipment cohort, evidence date, probability, trigger and expiry condition. |
Volume timing belongs beside rate treatment. A buyer can bring shipments forward, consume allocations early or create later spot exposure without changing full-year demand. The July 2026 U.S. container-import signal shows why freight, inventory and cash can move before the sales baseline does.
Treat congestion by lane and contract, not as automatically temporary
Maersk describes a structural shift in Ocean, citing container demand of about 4%, a growing head-haul and back-haul imbalance, and 10-15 years of underinvestment in port and landside infrastructure. Its Q2 materials also attribute higher container-handling costs to congestion and storage. Reuters reported that Maersk’s chief executive identified bottlenecks across several regions and said Shanghai berth waits had reached 12 days.
That evidence suggests some pressure may outlast a short incident. It does not prove that every surcharge, spot premium or lane increase will persist for the buyer’s budget horizon. Test four points before moving a disruption cost into the baseline:
- Contract status: has the cost entered a signed base rate or adjustment clause?
- Lane persistence: does a like-for-like benchmark show the move on the same port pair and service?
- Operational scope: is the cause local, network-wide or tied to one routing and shipment cohort?
- Exit condition: what contract, capacity, congestion or benchmark event resets the assumption?
A cost can be structural for one lane and temporary for another. The budget record should preserve that distinction.
What the USD 700 million EBIT sensitivity does and does not mean
Maersk’s Q2 interim report says that, all else being equal, a positive or negative USD 100-per-FFE freight-rate movement changes full-year 2026 EBIT by approximately positive or negative USD 0.7 billion. The table gives separate sensitivities for volume, bunker prices and foreign exchange.
This is a Maersk earnings sensitivity across its 2026 assumptions. It is not the amount a buyer should add for each USD 100 change, and it cannot be scaled to a shipper’s containers without lane rates, covered volume, contract terms and accessorial costs. It establishes material carrier exposure, not procurement budget impact.
The presentation contains a separate USD 700 million figure. Maersk estimates that extending vessel useful lives from 20 to 25 years will reduce 2026 depreciation by about that amount, with the effect included in underlying EBIT guidance. That accounting estimate has no direct meaning for a customer’s freight cost.
What procurement should lock before the next tender or forecast
- Build the lane ledger. Record forecast FFE, equipment, port pair, service, carrier allocation and required capacity period.
- Reconcile coverage. Separate committed from forecast volume and identify where early shipments create later exposure.
- Trace variable charges. Capture the clause, index, base, lag, reset date, cap, floor and invoice line.
- Benchmark like with like. Match port pair, equipment, inclusions and horizon; keep spot and long-term observations separate.
- Price accessorial risk. Model storage, demurrage, detention, rerouting and premium service only where they can occur.
- Govern the scenario. Give each uncontracted premium an owner, date, probability, period, trigger and expiry, then pass the cash timing to FP&A.
The controlling question is not whether Maersk’s outlook is bullish. It is which buyer obligations are committed, which can vary under signed terms and which remain exposed to the market.
What would change the budget treatment
Move a cost from scenario to baseline when a signed renewal fixes the rate, an index clause activates, or sustained like-for-like evidence supports the change across the budget period. Reduce or remove it when a surcharge expires, congestion clears on the lane, contracted capacity replaces spot exposure, or benchmark and invoice evidence reverse.
Maersk’s guidance is a recurring external signal, but the buyer’s evidence chain controls the budget. That chain starts with the contract, continues through lane-level benchmarks and invoices, and ends with a dated assumption that procurement and FP&A can challenge at the next review.