Cisco reported its fourth-quarter and fiscal-year results on August 12, 2026, with $4 billion of hyperscaler AI-infrastructure orders in Q4 and $9.3 billion for fiscal 2026. It reported approximately $4 billion of related revenue during the year and projects $7.5 billion for fiscal 2027. Q4 total non-GAAP gross margin was 66.3%, down from 68.4% a year earlier, while Q1 fiscal 2027 guidance is 65%–66%.
For procurement finance, the margin question is not whether orders are growing. It is whether commitments and cost assumptions behind a more hardware-heavy mix can be matched by productivity and customer price recovery. Cisco said the product-margin pressure came primarily from higher hardware mix and memory costs, partly offset by productivity improvements and price increases. Its earnings slides show $17.165 billion of total inventory purchase commitments at quarter-end. That balance is not an AI-only amount, and Cisco has not quantified each driver’s contribution to the guided range.
What changed and what it means
Unreconciled commitments or memory costs can compress product gross margin even as AI orders rise, while unsupported productivity or price recovery leaves the 65%–66% Q1 range exposed.
- Decision affected
- Approve or challenge the Q1 FY2027 margin plan only after reconciling inventory purchase commitments, component costs, hardware mix, productivity and realised customer price recovery.
- Evidence in brief
- Cisco disclosed $9.3 billion of FY2026 hyperscaler AI orders, $17.165 billion of total inventory purchase commitments and Q4 product-margin pressure from hardware mix and memory costs, partly offset by productivity and price increases.
- What remains unresolved
- Cisco has not quantified the AI-specific commitment share, Q4 maturity and supplier exposure, memory unit-cost movement, realised pricing recovery or each driver’s basis-point effect.
- Next verification
- Reconcile the commitment and purchase-price bridge against the fiscal 2026 Form 10-K when filed, then test Q1 results and pricing recovery on November 12.
Key takeaways
- Cisco finished fiscal 2026 with $9.3 billion of hyperscaler AI-infrastructure orders and approximately $4 billion of related revenue; the $7.5 billion fiscal 2027 revenue figure is a projection.
- Q4 non-GAAP product gross margin was 64.8%, down 270 basis points year over year, with Cisco citing higher hardware mix and memory costs as the primary pressures.
- Total inventory purchase commitments reached $17.165 billion, up from $16.033 billion in Q3 and $7.599 billion at the end of fiscal 2025, but Cisco has not identified the AI-specific share.
- Procurement finance should keep demand, commitment terms, component costs, hardware mix, productivity and price recovery on separate lines before accepting the 65%–66% Q1 margin range.
What changed in Cisco’s AI order and margin picture
At the end of Q3, Cisco’s prior AI-order outlook was $5.3 billion of hyperscaler orders year to date, approximately $9 billion for the full year and approximately $4 billion of fiscal 2026 revenue. The final order total came in $300 million above that estimate, while the revenue outcome remained approximately $4 billion.
Cisco said the Q4 and full-year hyperscaler order mix was approximately 60% Silicon One-based systems and 40% optics. That is an order mix, not a recognised-revenue mix, and it does not prove that the same split drove Q4 cost of sales. Orders, shipped products and recognised revenue need separate ownership in the margin model.
| Measure | Previous disclosed state | Current state | Finance treatment |
|---|---|---|---|
| Hyperscaler AI-infrastructure orders | $5.3bn year to date at Q3; about $9bn expected for FY2026 | $4bn in Q4; $9.3bn for FY2026 | Commercial demand metric, not revenue or gross profit |
| AI-infrastructure revenue | About $4bn expected for FY2026 | About $4bn reported in FY2026; $7.5bn projected for FY2027 | Keep observed revenue separate from the forward projection |
| Non-GAAP total gross margin | 66.0% in Q3 FY2026; 68.4% in Q4 FY2025 | 66.3% in Q4 FY2026; 65%–66% guided for Q1 FY2027 | Bridge product and services margins before testing the total range |
| Non-GAAP product gross margin | 64.3% in Q3 FY2026; 67.5% in Q4 FY2025 | 64.8% in Q4 FY2026 | Test mix, component cost, productivity and price recovery directly |
Reuters reported that Cisco’s 65%–66% Q1 range was slightly below an LSEG market estimate of 66.1%. The comparison explains the market focus, but it does not supply the operational bridge needed to judge whether Cisco’s sourcing and commercial assumptions can defend the range.
What the $17.2 billion commitment total does and does not signal
Cisco’s Q4 slides put inventory at $5.694 billion and inventory purchase commitments at $17.165 billion. The commitment balance increased by $1.132 billion, or 7.1%, from Q3 and by $9.566 billion, or 125.9%, from the end of fiscal 2025. Those are Finance Circuit calculations from Cisco’s disclosed balances.
| Balance | Q4 FY2025 | Q3 FY2026 | Q4 FY2026 | Decision boundary |
|---|---|---|---|---|
| Inventory | $3.164bn | $4.708bn | $5.694bn | Recorded stock, subject to demand, valuation and obsolescence controls |
| Inventory purchase commitments | $7.599bn | $16.033bn | $17.165bn | Future procurement obligations and arrangements, not inventory already received |
The latest detailed contract description available is Cisco’s Q3 Form 10-Q. It said a significant portion of reported purchase commitments was firm, noncancelable and unconditional. It also described fixed-dollar multi-year commitments used to secure supply and pricing for some components, long-term agreements for fixed quantities of memory with variable pricing, and some arrangements that could be cancelled, rescheduled or adjusted before firm orders were placed.
The filing linked the earlier combined increase in inventory and purchase commitments primarily to Cisco Silicon One and other products used to meet hyperscaler and other customer demand. It also said commitments had increased to secure memory. That supports a supply-chain connection, but it does not establish that all $17.165 billion at Q4 relates to AI, Silicon One or memory. Cisco has not published the Q4 maturity schedule, supplier allocation or pricing basis for the total.
Build the component-cost, mix and price-recovery bridge
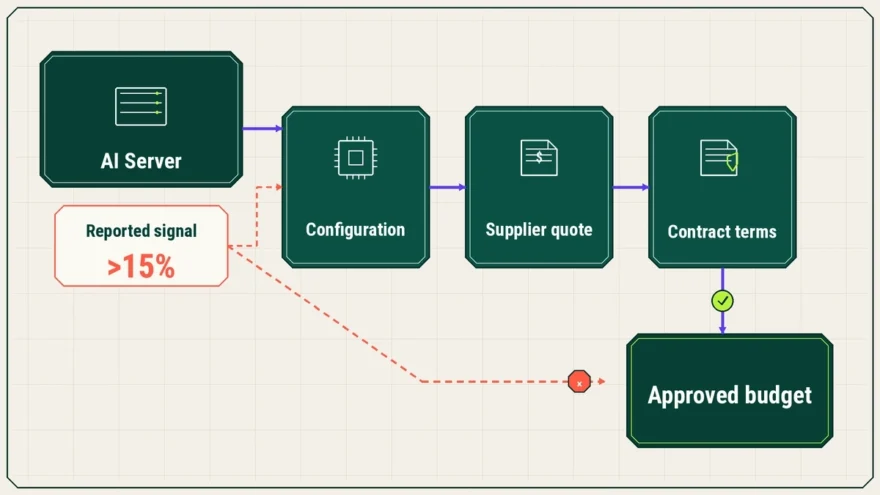
The margin bridge should start with shipped and recognised product mix, not the headline order total. A $1 increase in orders has no automatic same-quarter gross-margin effect. The effect depends on what ships, which components were committed, the purchase price applied, the revenue recognised and whether customer pricing was in force for that shipment. Sandisk’s contracted-bit and gross-margin model applies the same boundary: committed volume and floor pricing do not establish realised revenue, product mix or cost per bit.
| Bridge line | Evidence to reconcile | Margin control |
|---|---|---|
| Demand and revenue timing | Order, backlog, shipment and recognised-revenue states by product family | Do not use the 60/40 order split as a revenue or cost-of-sales split |
| Commitment exposure | Supplier, component, maturity, cancellation right, quantity and pricing basis | Separate fixed-dollar, variable-price and flexible arrangements |
| Component and manufacturing cost | Memory purchase-price variance, contract-manufacturer charges, freight and expedite costs | Keep each cost source visible rather than burying it in one productivity line |
| Hardware and product mix | Systems, optics and other networking revenue and cost by recognised shipment | Quantify mix separately from unit-cost movement |
| Productivity and price recovery | Manufacturing savings, yield, warranty, logistics and realised customer price by effective date | Avoid counting the same saving or price action in more than one bridge line |
The bridge should close first to non-GAAP product gross margin. Total gross margin also reflects services, where Cisco reported a 71.6% non-GAAP margin in Q4. A change in the product-services revenue mix can therefore move the total even when the product-cost bridge is unchanged.
What Cisco has not quantified
- the AI-specific share of the $17.165 billion inventory purchase-commitment balance;
- the Q4 commitment maturity profile, supplier concentration, cancellation rights or pricing basis;
- the unit-cost increase for memory or other constrained components;
- the basis-point contribution of hardware mix, memory costs, productivity improvements and price increases to Q4 product margin;
- the amount and timing of realised customer price recovery embedded in Q1 guidance; and
- the Q4 provision, if any, for commitments above future demand forecasts.
Any numerical allocation among those drivers is UNVERIFIED. The public evidence supports the direction of the pressures and offsets, not their individual weights or the internal sensitivity used to set the 65%–66% range.
What procurement finance should verify before Q1 results
- Metric map: lock separate definitions and owners for orders, expected revenue, shipped mix, recognised revenue and cost of sales.
- Demand-to-component bridge: reconcile the product forecast to bills of material, contract-manufacturer plans and component requirements.
- Commitment register: classify exposure by supplier, component, maturity, cancellation right, fixed or variable price and approved demand case.
- Purchase-price variance: isolate memory and other component movements from freight, expedite, yield, warranty and inventory provisions.
- Price-recovery tracker: separate announced price actions from prices accepted on orders, shipped and recognised in revenue.
- Margin reconciliation: assign each supported movement once, close to product gross margin, then apply the product-services mix to test the total range.
- Next verification: compare the bridge with the fiscal 2026 Form 10-K when filed and with Q1 results on Cisco’s scheduled November 12, 2026 call.
Cisco’s $9.3 billion AI order year strengthens the demand signal. It does not by itself prove margin protection. The procurement decision is whether commitment terms, component costs, productivity and realised pricing can be reconciled to the guided range without treating an order metric as a cost or revenue bridge.