SaaS statistics become misleading when the denominator disappears. An annual portfolio average is not a market forecast. A license that has no observed activity is not the same as an application used below purchased capacity. A list-price discount is not the same as savings against a prior contract, and a 93-day software buying cycle does not contradict a two-day requisition-to-purchase-order benchmark when the clocks start and stop at different events.
For CFOs, procurement leaders, FP&A, finance operations and IT-finance teams, the useful question is not which external number looks closest to the budget. It is which measure can test an internal decision. That requires a reconciled spend perimeter, contract and renewal evidence, license and consumption data, and a clear separation between committed value, invoiced spend, actual usage and forecast exposure.
Quick answer
This separates price, volume, mix and usage effects, turns renewals into planned decisions and prevents customer-cohort statistics from becoming unsupported budget assumptions.
Decision: Build the 2026 SaaS control plan around a reconciled spend perimeter, license-use evidence, contract deadlines and usage-based AI cost drivers rather than one market average or vendor waste percentage.
Key takeaways
- Zylo’s enterprise-weighted 2026 dataset reports average annual SaaS spend of $55.7 million and a median of $20.6 million. The $35.1 million gap shows why a mean should not become a universal budget target.
- License evidence measures different things. Zylo reports 54% average license use, while Vertice classifies 14% of licenses as fully unused and 51% as used below 50% of purchased capacity. Neither figure automatically equals cash savings.
- Purchasing control is decentralized. Zylo reports business units controlling 81% of SaaS spend, IT directly managing 15%, and the expense-channel share of spend rising 267% year over year.
- Renewal volume and contract defaults create a calendar-control problem. Zylo reports 211 renewals a year, while Vertice reports a 72.3% category average for auto-renewal clauses and 72% of tail-spend renewals proceeding without prior review.
- AI introduces both subscription and metered cost. Ramp’s connected cohort had median monthly token spend of $2,246 but an average of $140,842, while KPMG found partial AI-spend visibility in 42% of its global Q2 2026 respondents.
The 2026 SaaS spend and procurement benchmark table
The table below keeps each population, measure and period attached. Values from SaaS-management and procurement vendors describe their customer or connected cohorts. Survey values describe respondents. Gartner values are forecasts, not observed company budgets.
| Measure | 2026 reading | Population and boundary | Finance use |
|---|---|---|---|
| Annual SaaS spend | $55.7M average; $20.6M median | Zylo portfolios; 40M+ licenses and $75B+ discovered and categorized spend | Shows skew; calibrate only against a comparable internal cohort |
| SaaS spend per employee | $9,324 average in Q2 | Vertice processed-spend cohort; not the same statistic as Zylo’s $9,455 median | Normalize for headcount, then segment by role and application mix |
| License use | 54% used; $19.8M cost attributed to unused licenses | Zylo enterprise-weighted portfolio data; activity window and costing rules matter | Creates a review pool, not a booked savings figure |
| Unused and underused licenses | 14% fully unused; 51% below 50% use | Vertice Q2 2026 license data; combined figure is 65% | Separate removal candidates from tier or seat-rightsizing candidates |
| Decentralized spend ownership | 81% business units; 15% IT | Share of SaaS spend in Zylo’s 2026 dataset | Join finance channels to contract, owner and usage records |
| Renewal workload | 211 renewals a year; 79% encountered price increases | Zylo portfolio mean plus IT-leader survey incidence | Tier reviews and start before the cancellation deadline |
| Auto-renewal clauses | 72.3% category average in Q2 | Vertice software-contract categories; weighting is not fully disclosed | Track notice date separately from renewal date |
| Tail renewals without review | 72% | Vertice tail-spend contracts; distinct from clause prevalence | Use risk and value tiers rather than skipping the long tail |
| Vendor price inflation | 12.1% April; 14.2% May; 16.4% June | Vertice software-price series, not CPI and not total budget growth | Test renewal quotes and build a price bridge by vendor |
| Discount from list price | 33.8% average; 44% ERP; 43% AI; 19% design | Vertice Q2 contract data; starting list price can differ by deal | Use comparable transactions, not one category average |
| AI renewal price asks | 20% to 37% initial; about 12% after negotiation | Tropic customer renewals observed in 2025; $18B+ spend under management | Separate opening ask, negotiated uplift and added scope |
| AI token spend | $2,246 monthly median; $140,842 average | Ramp Token Spend Management connections, April 2026 | Use percentiles and unit economics, not the mean alone |
| AI cost visibility | 42% partial visibility; 23% struggle with usage costs | KPMG survey of 2,145 senior leaders across 20 markets | Put cost review, dashboards and ownership into approval |
| Software procurement cycle | 54 to 93 days by deal size | Employee request to signed software deal in Vertice Q2 data | Measure stage delay and run independent reviews in parallel |
| Requisition to purchase order | 2.0-day median | APQC all-company benchmark, 1,250 responses; requisition received to PO released | Do not compare with request-to-signature without reconciling endpoints |
First fix the denominator: seven distinctions that change the answer
| Terms often combined | Required distinction | Decision consequence |
|---|---|---|
| SaaS, software, cloud and IT spend | SaaS is subscription application software. Total software can include non-SaaS licenses and maintenance. Cloud can include infrastructure and platforms. IT also includes devices, services and communications. | Do not apply a broad market growth rate to a SaaS renewal budget. |
| Licenses and users | A user can hold several licenses; a license can be shared, role-based, feature-limited or consumption-based. | Reconcile contract entitlements, assignments, active identities and product telemetry. |
| Unused, underused and wasted | Unused means no qualifying activity. Underused means activity below a stated threshold. Waste adds an economic judgment about recoverability and value. | Validate removal, downgrade or true-down rights before recognizing savings. |
| Average and median | The mean is pulled upward by large portfolios or heavy users; the median describes the midpoint. | Use both and add percentiles where the distribution is wide. |
| Contracted and actual spend | Contract value may include minimum commitments, prepaid amounts or optional scope. Actual spend can include overages, taxes, credits and foreign-exchange effects. | Maintain a commitment-to-invoice-to-cash reconciliation. |
| Price inflation and budget growth | A vendor-price index measures price movement. A company budget also changes with seats, product mix, usage, acquisitions, cancellations and exchange rates. | Bridge rate, volume, mix, scope and currency separately. |
| Observed and forecast | Platform data records a named cohort; surveys record answers; forecasts model a future market total. | Attach source type and period to every benchmark used in planning. |
This boundary matters at market scale. Gartner’s July forecast puts 2026 worldwide IT spend at $6.369 trillion and software at $1.468 trillion, with forecast growth of 14.2% and 15.5% respectively. Those modeled vendor-sales totals are not SaaS-only and cannot tell one company what its subscription budget should be.
SaaS spend is large, skewed and not a universal budget target
Zylo’s mean and median are the clearest warning against a single “average company” figure. Its average annual SaaS spend is $55.7 million; its median is $20.6 million. Our calculation puts the gap at $35.1 million. The same index reports an average of 305 applications and a median of 240. Large portfolios pull the mean upward, and the customer base is not a random sample of every company.
Per-employee numbers also need their statistic labels. Vertice reports an average of $9,324 per employee in Q2 2026. Zylo reports a median of $9,455. The values look similar, but mean and median are not interchangeable, and the cohorts and spend-discovery methods differ. Finance should calculate its own annualized software cost per active employee, then segment it by role, business unit and application category before comparing.
The internal perimeter should start with more than the contract repository. AP, corporate cards, employee expenses, procurement records, identity systems and vendor invoices can each reveal different parts of the population. The spend-data readiness tests explain how to bound and reconcile those sources before a category total or savings claim is trusted.
License utilization and waste: build a review pool before a savings case
Zylo reports that only 54% of licenses were active in the measured period and assigns $19.8 million in annual cost to unused licenses in its cohort. Vertice uses a different split: 14% fully unused and 51% used below 50% of purchased capacity. The combined 65% is a license classification, not a statement that 65% of spend can be removed.
A finance-grade review needs four stages. First, confirm the entitlement and activity window. Second, classify zero activity, intermittent activity, low-capacity use, wrong tier, duplicate function and legitimate reserve capacity separately. Third, check contract rights and service dependencies. Fourth, record realized savings only when a renewal, cancellation, downgrade, credit or redeployment changes the economic outcome.
This is why the repeated claim that “30% of SaaS spend is wasted” should not be used as a current universal benchmark without recoverable provenance, population and definition. Even a verified zero-use seat can be non-cancellable during the term. Conversely, a heavily used product can still be economically poor if the price, tier or outcome is wrong.
Decentralized purchasing makes the control tail larger than the spend share
Zylo’s survey and portfolio release say business units control 81% of SaaS spend while IT directly manages 15%. It also says the expense-based share of SaaS spend increased 267% year over year. That is relative growth in a spend channel, not a 267-percentage-point increase and not proof that every expensed purchase is unauthorized.
Decentralization changes the discovery design. A contract repository misses card and expense purchases. An AP ledger can miss free-to-paid conversions and embedded AI features. An identity feed can find access but not contractual commitment. The finance technology model therefore needs stable vendor, application, owner, cost-center, contract, user and consumption identifiers across systems. The finance technology reference architecture provides the system-role context for that record design.
The operating rule is to make the request path easier than bypassing it while keeping a low-friction route for small, low-risk purchases. Every exception still needs an owner, an evidence trail and a point at which security, privacy, commercial and budget checks become mandatory.
Renewals and contracts turn calendar discipline into a financial control
An average of 211 renewals a year is roughly four renewal events per week. That volume makes a single annual clean-up unrealistic. Zylo also reports that 79% of surveyed IT leaders encountered a price increase at renewal. Incidence does not reveal the size of the opening ask, the final negotiated increase or whether scope changed, but it does show why late review is expensive.
Vertice reports a 72.3% average across software categories for contracts containing auto-renewal clauses in Q2 2026. A separate Vertice measure says 72% of tail-spend renewals proceeded without prior review. These are different denominators: one measures clause prevalence across categories, while the other measures review behavior in a defined tail population.
For each contract, track the cancellation deadline, renewal date, price-notice date, committed quantity, true-up or true-down rights, usage window, owner and review tier. Start material reviews at 120 or 90 days, not when the invoice arrives. The source-to-pay control model shows where intake, contracting, purchasing and downstream evidence should change hands.
Pricing and negotiation: list discount is not realized savings
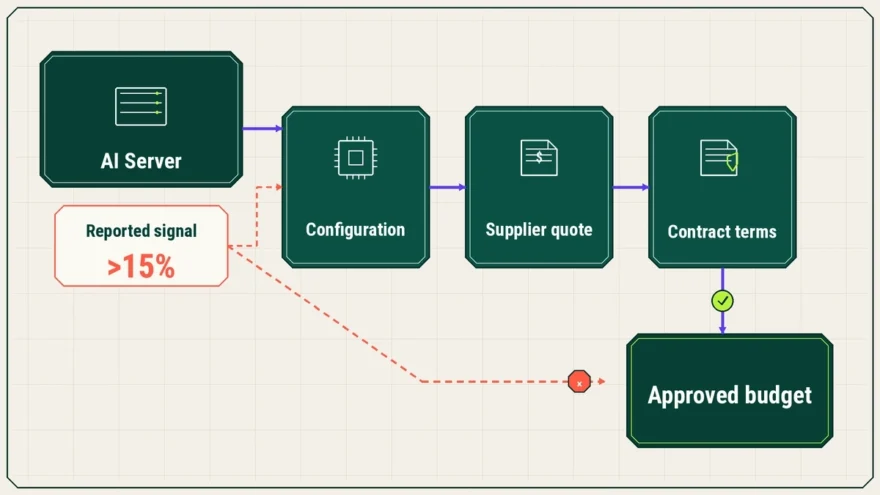
Vertice’s price series reached 16.4% in June after 12.1% in April and 14.2% in May. Zylo reports an 8% year-over-year increase in average annual SaaS spend. Subtracting one rate from the other would be invalid: the first is a proprietary vendor-price measure, while the second is total portfolio spend growth affected by price, seats, mix, usage, discovery and customer composition.
Vertice also reports an average 33.8% discount from list price, with category averages ranging from 19% for design software to 44% for ERP. This is the distance between list and negotiated price in its data. It is not necessarily savings against the current contract, a comparable market quote or the budget. The ERP cost framework shows why licenses, implementation, integrations, support and internal change cost must stay separate.
Tropic’s customer-renewal data gives a more specific AI-pricing example. Initial AI-related renewal asks were 20% to 37%, compared with historical uplifts of 3% to 9%. Across deals with flexibility, Tropic reports roughly a 55% reduction in those asks and a final average uplift near 12%. A buyer still needs to test whether the final deal added users, products, features, consumption rights or longer commitment.
A defensible renewal bridge starts with the prior recurring run rate, then isolates list or unit-rate change, seat and tier movement, usage or overage, added and removed modules, term, credits, taxes and currency. Procurement can then label avoided cost, price reduction, cost reduction and budget variance separately.
AI software spending needs four cost views, not one “AI budget”
Zylo reports 108% year-over-year growth in AI-native application spend and says 78% of surveyed IT leaders encountered unexpected AI or consumption charges. Ramp’s connected token cohort shows why fixed subscriptions and metered use must be separated: the April 2026 monthly median was $2,246, the average was $140,842, the 90th percentile was $73,030 and the 99th percentile was $831,338.
Ramp also reports a $46 median monthly token cost per employee, with the middle 50% ranging from $3 to $352. Premium models represented 45.8% of tokens but 55.9% of cost. These figures describe businesses connected to Ramp’s Token Spend Management product, not every corporate AI user, yet they show the forecasting risk created by model choice, automated workflows and heavy-tail usage.
KPMG’s Q2 2026 survey adds the control view: 42% of 2,145 senior leaders reported only partial visibility into AI spend, 23% struggled with usage-based costs and 33% struggled with cost structures or token economics. The FinOps Foundation’s 2026 practitioner survey, based on 1,192 respondents representing more than $83 billion in annual cloud spend, says 98% now manage some AI spend and 90% manage SaaS costs or plan to within a year.
Finance should maintain four linked views: seat subscriptions, embedded AI add-ons, token or API consumption, and the cloud or data infrastructure that supports AI workloads. Each needs a budget owner, unit rate, commitment, allocation key, alert threshold and outcome measure. The finance systems integration map is the next step when invoice, usage and ownership evidence sit in different applications.
Procurement cycle benchmarks require matching start and end events
Vertice’s Q2 2026 averages rise with contract value: 54 days under $10,000, 73 days from $10,000 to $50,000, 81 days from $50,000 to $100,000 and 93 days above $100,000. Its endpoint is the employee request through the signed software deal. The public data comes from Vertice’s processed-spend cohort and does not disclose a deal count for each band.
APQC’s median is two calendar days from purchase requisition received to purchase order released, based on 1,250 all-company responses. That clock starts later and ends at a different control point. Neither source invalidates the other. Combining them would hide intake, sourcing, security, legal, contract and approval stages inside one number.
Measure timestamps for request accepted, scope complete, budget confirmed, security complete, legal complete, commercial agreed, approval complete, signature and PO release. Segment new purchases from renewals and route reviews by value, data risk and business criticality. The requisition control boundaries help define what evidence must be complete before downstream cycle time starts.
A 2026 SaaS control set for CFOs, procurement and IT-finance
| Control | Evidence | Cadence | Primary decision |
|---|---|---|---|
| Spend perimeter | AP, card, expense, contract, invoice and identity reconciliation | Monthly | What is in scope, duplicated or ownerless? |
| License and usage | Entitlement, assignment, activity, tier and contract-right evidence | Monthly; intensified before renewal | Remove, redeploy, downgrade, true down or retain? |
| Renewal calendar | Notice, renewal, price-notice and review dates with accountable owner | Continuous; 120/90/60-day gates | Renew, renegotiate, consolidate, compete or exit? |
| Price bridge | Prior run rate plus rate, volume, mix, usage, scope, term and currency changes | Every material renewal and forecast cycle | What caused the variance and what is negotiable? |
| AI cost envelope | Seats, add-ons, tokens, model mix, automated jobs and infrastructure | Weekly alerts; monthly review | Which use has an owner, ceiling and measurable outcome? |
| Procurement cycle | Stage timestamps, first-pass completeness, exceptions and rework | Monthly by risk and value band | Where is elapsed time waiting, working or repeating? |
The common design is a small central standard with distributed accountability. Procurement owns commercial process and contract evidence; IT or software asset management owns application and entitlement visibility; security and legal own their reviews; finance owns the spend perimeter, budget treatment and realized financial result; business owners remain accountable for need and outcome.
How to use these statistics
This article is current through August 25, 2026. It gives priority to direct platform, transaction, contract and usage data for observed behavior; APQC for a tightly defined process benchmark; named surveys for visibility and practice; and Gartner only for forecast market context. Vendor customer cohorts are named because their figures are not universal company benchmarks.
For an internal benchmark, preserve the source, population, statistic type, period, numerator, denominator, endpoint and calculation. Refresh this page when a source issues a new annual index, changes a definition, replaces a public page, revises a forecast or publishes a later quarter. A benchmark should be retired when its provenance or denominator can no longer be recovered.
Frequently asked questions
What percentage of SaaS licenses are unused in 2026?
There is no single universal percentage. Zylo reports 54% average license use in its enterprise-weighted dataset, while Vertice reports 14% fully unused and 51% used below 50% of purchased capacity in Q2 2026. Keep the cohort, activity threshold and distinction between unused and underused attached before estimating a rightsizing opportunity.
How much should a company budget per employee for SaaS?
External per-employee figures are calibration points, not a universal budget. Vertice reports a Q2 2026 average of $9,324, while Zylo reports a $9,455 median for its cohort. Calculate internal annualized cost per active employee, segment by role and application mix, and reconcile contracts, invoices, expenses and usage before comparing the result.
How long does SaaS procurement take?
Vertice reports 54 to 93 days from employee request to signed software deal in Q2 2026, depending on contract value. APQC reports a two-day median from requisition received to purchase order released. Define the start, end, population and stages before comparing either figure with your process, then measure waiting and rework separately.